AI Infrastructure Hegemony Wasn't Decided at the Chip - NIA Trend 1, Revisited at the Half-Year
Prediction vs. now: infrastructure hegemony arrived faster than forecast (🔵) Placing NIA’s two predictions next to six months of what actually happened. Prediction 2, compute alliances and bloc formation, landed as forecast (🔵). Prediction 1, semiconductor diversification, was directionally right but aimed at the wrong spot (🟢). The capex circular-financing bubble and the serving-software efficiency lever were in neither prediction (⚪).
Following the approach set in Part 0, we take each of NIA’s two prediction sentences for Trend 1 and hold it against what actually happened. The 🔵 above is the realization of the trend as a whole, but the two predictions did not land the same way.
NIA set two predictions under Trend 1, “Intensifying contest for AI infrastructure hegemony.”
- Prediction 1: major powers cultivate semiconductors as a strategic industry, and the AI-chip market diversifies as the development race accelerates.
- Prediction 2: alliances and bloc formation around AI compute resources deepen.
Both rest on one piece of conventional wisdom: that AI infrastructure hegemony is a question of “who secures the better chip, and more of it.” Six months of reality did not flatly overturn that idea, but it did shift the center of gravity off the chip. Compressed to one line: hegemony did intensify, but the variable that decided it moved from the chip itself to the chain of bottlenecks lined up behind the chip. NIA named the arena correctly and missed where the match was actually won.
Prediction 2, compute alliances and blocs - as forecast (🔵)
Start with the more accurate of the two. The move toward alliances and blocs in compute resources unfolded as predicted, if anything more strongly than predicted.
The biggest signal is the blocking-up of capital itself. OpenAI’s Stargate project was announced at a total of $500 billion, and nations put securing their own compute on the national agenda. The EU allocated on the order of EUR 1 billion to build a Europe-led AI ecosystem and drew up AI-factory deployment plans; China placed AI-compute self-reliance at the top of its 15th Five-Year Plan alongside quantum and 6G. Korea, under the so-called “K-Nvidia” push, set a plan to secure more than 260,000 sovereign-AI GPUs by 2030, and the National AI Computing Center run by Samsung SDS signaled expansion from 15,000 to 50,000 units. The very move by states to hold compute directly is what Prediction 2 called bloc formation.
The chip supply chain split into camps too. External sales of custom silicon (ASIC, application-specific chips built for one purpose) hardened into what is effectively an alliance structure. Google agreed to supply its own TPU (Tensor Processing Unit) to Anthropic at 3.5 gigawatts (GW), and Broadcom locked in OpenAI as its sixth custom-accelerator customer. NVIDIA tied MediaTek, Marvell, and Astera into its camp through NVLink Fusion, which opens its NVLink interconnect standard to outside partners.
The alliance structure is visible in the numbers. Broadcom’s AI revenue jumped from $8.4 billion in fiscal Q1 2026 to a Q3 guidance of $16.0 billion (an estimated +200% year over year), holding 60-70% of custom-accelerator design. Add Marvell and roughly 95% of custom-chip co-design concentrates in the two firms. The market hardened not into “NVIDIA versus the rest” but into camps, each hyperscaler bringing a partner that designs its own silicon.
Physical construction took on the character of camp warfare as well. Amazon is building 18 buildings of its Rainier cluster in Indiana exclusively for Anthropic and has installed more than a million of its own Trainium2 chips; Elon Musk’s xAI grew Colossus from 100,000 GPUs to 200,000. The framing that compute is national power and corporate strategy is exactly NIA’s Prediction 2.
Compute bloc formation overlaps with chip geopolitics and export controls (Trend 6, tech sovereignty). This part covers only the alliance structure from an infrastructure angle; norm contests like the extraterritorial reach of export controls are handled separately in Part 6.
Prediction 2 was right in both direction and intensity. Compute clearly became a matter of nations and camps. This far, NIA saw it well.
Prediction 1, semiconductor diversification - right direction, wrong focus (🟢)
Prediction 1 is different. The direction itself, “the AI-chip market diversifies,” did unfold over six months. The problem is that NIA treated diversification purely as a matter of chip competition.
Diversification did happen. AMD’s MI450, with 432 gigabytes of HBM4 (fourth-generation high-bandwidth memory) against NVIDIA Rubin’s 288GB, locked in OpenAI, Meta, and Oracle and created a real competitive structure for the first time. The growth rate of custom ASICs outpaced GPUs (44.6% vs. 16.1%, estimated). Korea’s neural processing units (NPUs) entered mass production.
But the real weight of the contest is not as simple as the spec sheet. On a three-year total cost of ownership (TCO) basis for 32 cards, AMD hardware runs 30-50% cheaper than NVIDIA, but software-engineering costs run roughly three times higher and training utilization lags by 15-25%. AMD’s edge is clear only on large inference workloads. Diversification opened, but it opened narrowly, on top of the moat of NVIDIA’s 15-year software ecosystem (CUDA).
So by absolute shipments, GPUs still account for 69.7% of all AI-accelerator shipments, custom ASICs for 27.8% (TrendForce). NVIDIA holds most of those GPUs, keeping its vendor share around 75%. The point where ASICs overtake GPUs in shipments is pushed out to 2028. “Diversification” is a story that played out only on top of growth rates; the hegemony of actual volume did not budge.
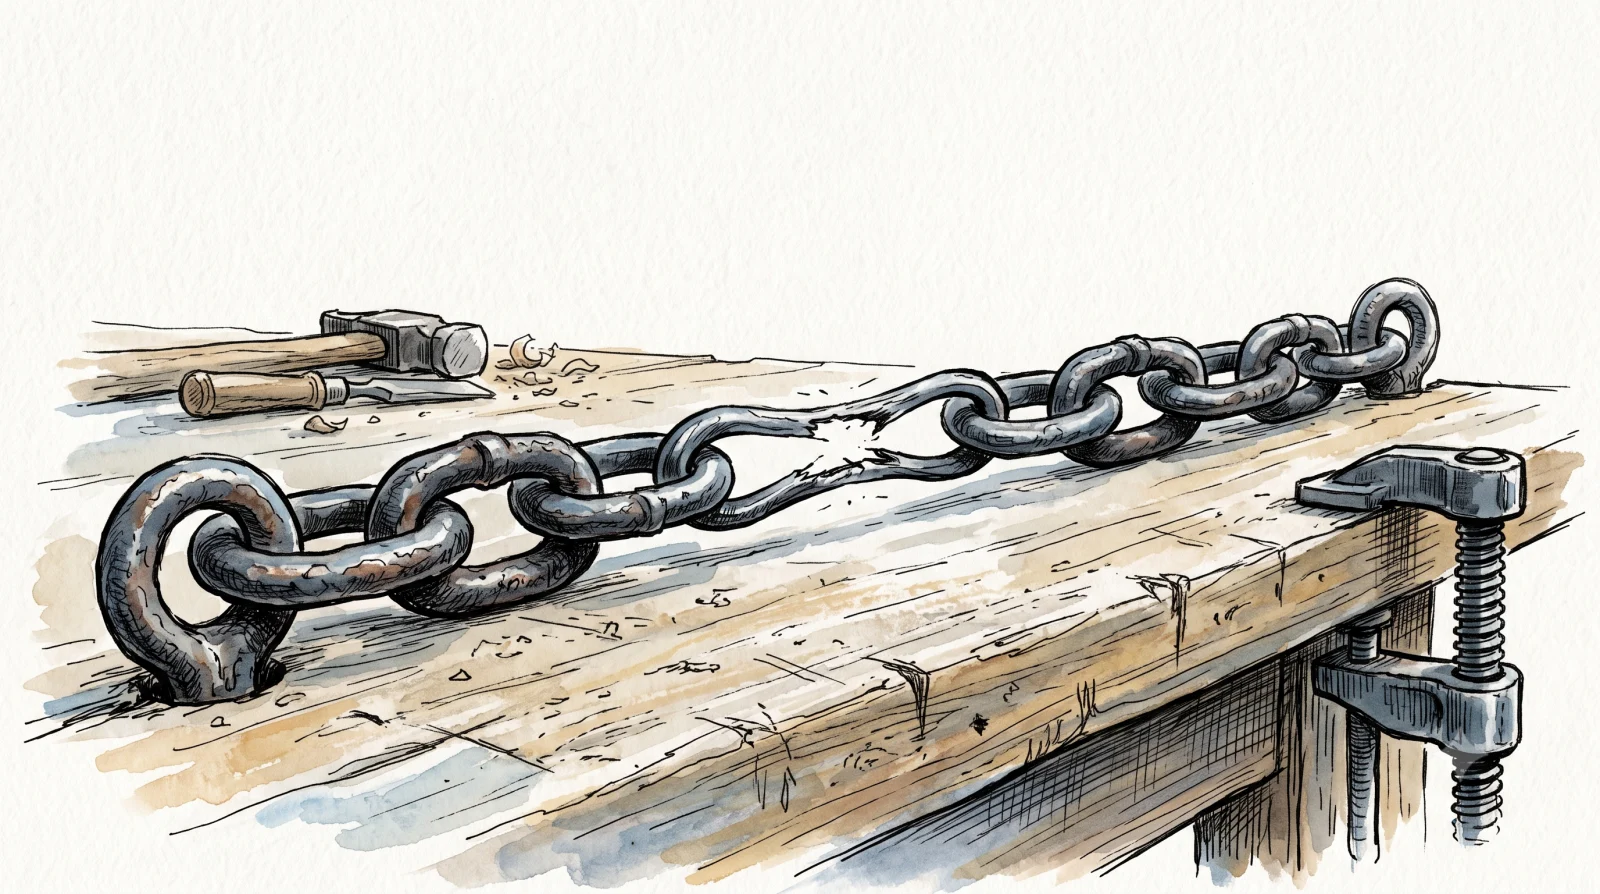
More important, the variable that actually decided hegemony over the six months was not the chip. The match was won in the chain of bottlenecks lined up behind the chip.
---
config:
  look: handDrawn
  theme: neutral
---
flowchart LR
    A["Chip<br/>GPU · ASIC"] --> B["HBM4 · CoWoS<br/>memory·packaging"]
    B --> C["Capital<br/>capex·circular finance"]
    C --> D["Power·facilities<br/>transformers·cooling"]
    D --> E["Serving SW<br/>throughput optimization"]
Each stage neutralizes the advantage of the one before it. However many chips you have, if the next link jams, hegemony is cut off there. The links that actually got cut over the six months line up like this.
| Stage | Real bottleneck | Evidence (H1 2026) |
|---|---|---|
| Memory·packaging | HBM4·CoWoS shipment ceiling | Three vendors pass HBM4 qualification (SK 60-70%, Samsung 25-30%), CoWoS sold out for 2026 |
| Power·facilities | gap between announced and operational | Of Stargate’s 10GW target, only about 4 of 8 buildings at the flagship Abilene site running; transformer lead time about 5 years |
| Cooling | liquid cooling becomes mandatory | Pure air-cooling share falls to 45%, 59% plan liquid cooling within 5 years (451 Research) |
| Serving SW | throughput varies several- to tens-fold on the same chip | Dynamo up to 50x on MoE (vendor), SGLang 29% over vLLM |
Even with chips secured, if you cannot get an allocation of HBM4 and CoWoS (the advanced packaging that stacks and bonds chips), shipment stalls. Taiwan’s TSMC has already sold out CoWoS volume for 2026, and lead times reach 52-78 weeks. To build a cluster you face a five-year transformer lead time, and a Rubin-class rack draws 150 to 600 kilowatts (kW) per rack, impossible to run without liquid cooling. Stargate was announced with a 10GW target, but six months on, what is actually energized and running is about 4 of the 8 buildings at the flagship Abilene site. The gap between the announced plan and actual operation is precisely the power bottleneck.
The memory ceiling is even more structural. NVIDIA confirmed three-vendor HBM4 qualification through Jensen Huang’s June remarks, but on actual volume, SK Hynix took 60-70% by mass-producing 16-high stacks via hybrid bonding in February 2026, while Samsung is still catching up with 1c DRAM yields in the 50% range. However far ahead the chip design is, without an allocation of this bottleneck the shipment schedule slips. Over six months the truly scarce resource was not GPU dies but HBM stacking and packaging lines, and the match for what NIA called “semiconductor cultivation” was won right there.
Prediction 1’s direction (diversification, accelerating development race) was right. But while NIA pointed its camera at the chip, hegemony was being decided off-frame, in memory, power, and cooling. Hence 🟢, right direction with the focus off the mark.
What NIA didn’t see at all - the capex bubble and serving software (⚪)
Pull the predictions apart and two first-order variables surface that are named nowhere in either one. The method’s backward-looking nature, flagged in Part 0, shows up here directly.
The first is the capex (Capital Expenditure) bubble debate. The rating firm CreditSights put the top-five hyperscalers’ 2026 capex at about $750 billion, revised up within six months from a January estimate of about $620 billion, a third straight year of 60%-plus growth.
The trouble is how the money circulates. The loop of mutual investment and purchase running from NVIDIA to OpenAI to Oracle to the cloud firm CoreWeave passes $800 billion in 2026 (estimated). OpenAI’s total committed compute spend is on the order of $1.15 trillion, against 2025 revenue of about $13 billion - the commitment is nearly 90 times revenue.
Accounting raised warnings too. Meta extended server useful life from 4-5 years to 5.5, lifting book operating income by $2.9 billion with no revenue increase. Adjust depreciation back to a three-year basis and Microsoft’s and Alphabet’s earnings per share (EPS) fall by about 8%, Meta’s by more than 15%, by one calculation. Michael Burry shorted NVIDIA and Palantir and likened the structure to Enron.
The weakest point in the capital link of the bottleneck chain is the Neocloud. CoreWeave carries a debt-to-equity ratio (D/E) of 8.94 and posted a quarterly net loss of $740 million while holding a backlog of $99.4 billion. Yet only 36% of that backlog is recognized as revenue within 24 months, and customer concentration is high (Meta $21 billion, OpenAI $22.4 billion). Contracts pile up, but the speed at which they turn into revenue and then cash, plus single-customer dependence, is the heart of the risk. When chips and contracts are plentiful but the capital-recovery clock slips, the chain snaps at exactly this link.
The second is the lever of serving-software efficiency. On the same chip, throughput varies several- to tens-fold from software optimization alone. Concretely, on the same H100, SGLang runs 29% higher throughput than vLLM (16,200 vs. 12,500 tokens per second), and NVIDIA’s Dynamo pushes up to 50x on mixture-of-experts (MoE) models (vendor claim). Inference cost is falling around 50x per year (Epoch AI median).
Here the Jevons Paradox kicks in (the phenomenon where efficiency gains raise total consumption rather than lowering it). While per-token price fell 280-fold over two years, actual billing rose 320%. Google’s internal token throughput jumped from 0.5 trillion per day in March to over 3 trillion in May, and Uber burned through its 2026 AI budget in four months. Real competitiveness became not how many chips you secured but how cheaply you extract tokens from them - an axis missing wholesale from NIA’s two predictions.
These two variables were subjects still low in frequency in late-2025 forecast reports. As long as text-network analysis pulls trends from word frequency, a decisive variable with low frequency structurally fails to make the top 12. The backward-looking method flagged in Part 0 shows through directly in Trend 1.
One thing worth flagging - Korea’s lever is not the chip
Mapping this comparison onto Korea, the direction is clear. Six months of reality show that Korea’s real lever is not “K-Nvidia” chip sovereignty.
Korea actually holds two cards. One is HBM sovereignty. SK Hynix takes 60-70% of HBM4 for NVIDIA Rubin, sitting in the position that governs the shipment ceiling. The other is a seat that could become serving-software sovereignty, still empty. Naver runs HyperCLOVA X and SK Telecom runs A.X, but there is no independent edge yet in the serving-optimization stack.
By contrast, domestic chips are thin on results relative to their symbolism. FuriosaAI’s RNGD delivered 2.25x performance per watt in joint validation with LG, and Rebellions (merged with Sapeon) released Rebel100. The National Growth Fund allocated about 800 billion won to Furiosa and 250 billion to Rebellions. But both chips lack independent benchmarks and their global revenue is early-stage. Naver’s decision to adopt up to 200,000 units of Samsung Mach-1 ($752 million) is a symbol of compute sovereignty, but it too is an inference-specialized choice that uses low-power memory instead of HBM.
The government too draws a picture of growing the National AI Computing Center run by Samsung SDS from 15,000 to 50,000 GPUs and securing more than 260,000 sovereign-AI GPUs by 2030. But most of that volume target is a plan to buy NVIDIA GPUs, a different story from domestic chips. The strategic priority this comparison points to runs against the conventional wisdom. Chip sovereignty tends to stay symbolic in front of the CUDA moat, while HBM is an irreplaceable seat that SK Hynix already holds at the world’s shipment ceiling. Whether to concentrate resources on the unshakable lever or spread them across the symbolic seat is the fork for the next round.
On top of this, the capex bubble debate is a direct warning to Korea. The recovery clock on the data-center investment the three telcos and Naver are pushing sits exactly where the circular-financing and depreciation debates take aim. And as long as power and facilities hit their limit before chips do, Korea’s data-center strategy has to be tied not to chips but to power (Trend 9) and domestic cooling. Naver’s Gak Sejong at up to 270 megawatts (MW) and KT’s first domestic commercial direct-to-chip liquid cooling in Gasan (26MW, 20-30% power savings) are early signals in that direction.
Closing - right stage, wrong battleground
Held against the predictions, Trend 1 comes out like this.
| Item | Prediction vs. now | One line |
|---|---|---|
| Prediction 1, semiconductor diversification | 🟢 | right direction, focus stuck on the chip, missed the bottleneck |
| Prediction 2, compute alliances·blocs | 🔵 | as forecast, if anything stronger |
| Missed | ⚪ | capex circular-financing bubble, serving-SW efficiency lever |
| Trend overall | 🔵 | infrastructure became the arena, but the battleground was outside the forecast |
Prediction 2 (alliances·blocs) landed. Prediction 1 (semiconductor diversification) was directionally right but, with its focus tied to the chip, sidestepped the bottleneck that actually decided hegemony over the six months. And the two first-order variables, capex circular financing and serving software, were nowhere in the predictions.
In the big picture, early realization (🔵) holds. AI infrastructure clearly became the battleground of this era, faster and harder than predicted. But what Trend 1 shows is that a prediction built from the word frequency of a year-ago discourse can point to the arena but cannot name the battleground. Hegemony was decided not at a single chip but across the whole chain behind it, and the weakest links in that chain (power, HBM, capital recovery) happened to be the very things a prediction is slowest to catch.
This is not NIA’s problem alone. Any report that organizes discourse on a yearly cycle will structurally be late to a bottleneck that has not yet risen much in the discourse. Trend 1 is the case where that lag opened widest, and it happened that the six months’ real match sat inside that lag. If the point of this comparison is not “who was wrong” but “where the format of prediction runs late,” Trend 1 is the first case that shows most sharply what that lateness looks like.
In the next part, we hold Trend 2, self-working AI agents, up the same way, and see whether the direction and the battleground split here too.
The source this series holds as its reference is NIA, “NIA’s Outlook: 2026 Top 12 AI & Digital Trends” (IT & Future Strategy, Volume 6, December 31, 2025). Evidence for H1 2026 developments prioritizes primary sources: NVIDIA·Broadcom·Marvell IR/SEC filings, TrendForce·Counterpoint·SemiAnalysis·CreditSights, FuriosaAI·LG AI Research·Rebellions·CoreWeave IR, Epoch AI, and 451 Research.
Related Posts

Re-reading a One-Year AI Forecast at the Half-Year Mark - NIA's 2026 Trend Report
Reads NIA's 2026 Top 12 trends report on its own terms - identity, structure, derivation method - and flags the backward-looking nature of text-network analysis. Series entry post.

Where AI Value Accrues: Benedict Evans and Jensen Huang's Two Maps
Evans and Jensen both treat the model as a commodity, then split on whether value flows up to apps or down to infrastructure

AI eats the world 2026 - Reading Benedict Evans' 79-slide deck
Evans 2026 deck notes - three chapters held together by one question: infrastructure boom rarely turns into value capture